How to Check GPU Health? Complete Guide
If you’ve noticed that your PC or laptop is running slow, games or software are lagging, the screen is flickering or going black, or the system is overheating and restarting suddenly, these can be signs that your GPU health is not good. But don’t worry! You can easily check GPU health using Windows’ built-in options, such as Task Manager, Device Manager, and the DirectX Diagnostic Tool, which are available in all Windows versions.
Regularly monitoring GPU health, especially during gaming or other demanding tasks, helps you detect hardware issues early, allowing you to address them promptly and keep your entire system running smoothly.
How to Check GPU Health Without Any Tool?
You can instantly check GPU health with the three most common methods, without the need to download any extra tools. Additionally, we have provided easy shortcut keys to access each technique quickly.
1. Task Manager
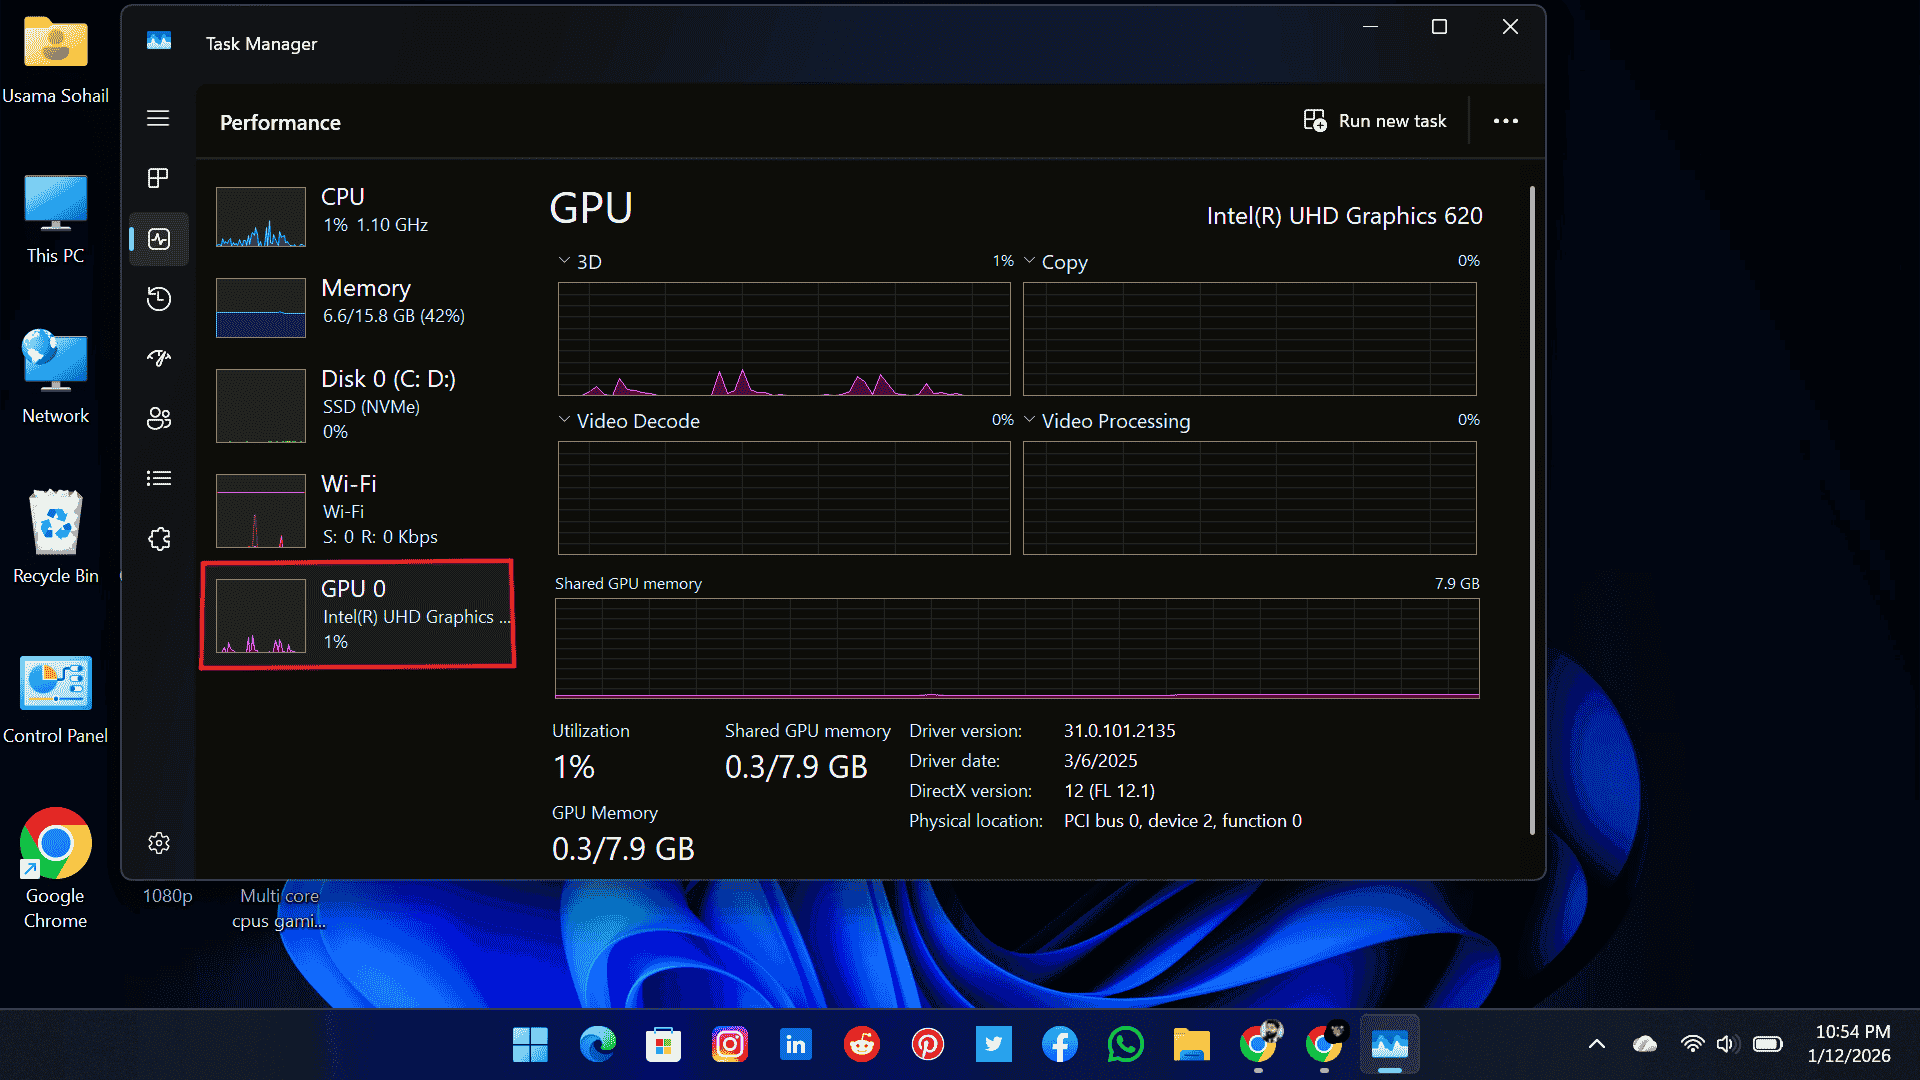
Here, you can check GPU health and its usage, VRAM usage, temperature (if supported), and clock speeds in real-time. GPU usage is divided into multiple categories, including 3D, Copy, Video Decode, Video Processing, Engine, Overlay, and GDI Render.
Each one tells you how your GPU is handling different jobs, like rendering graphics, playing videos smoothly, or powering through 3D work. Monitoring these categories can help you identify which part of the GPU is under heavy load or causing slowdowns.
2. Device Manager
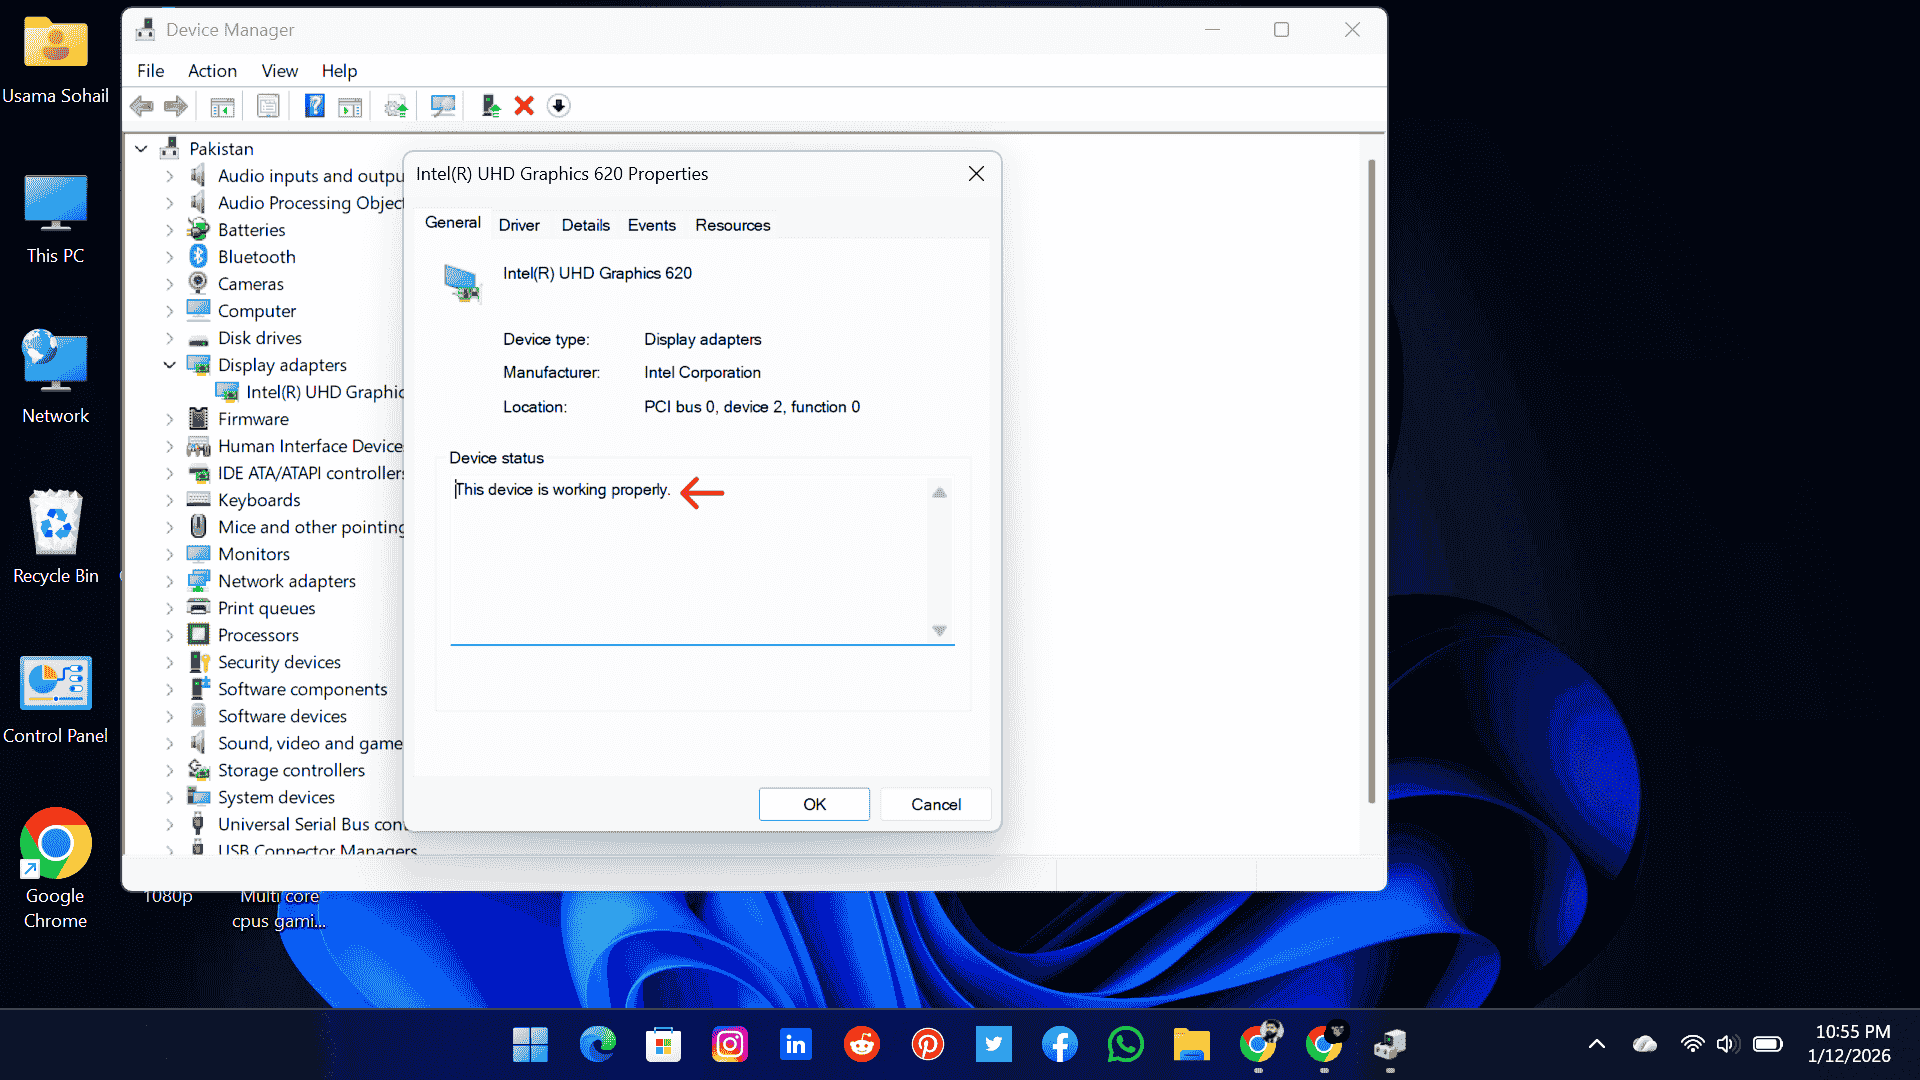
Here, you can show a clear statement about whether your component is working properly or not. If it says “This device is working properly,” then that’s a good sign for your PC. If it is not working properly, there can be several reasons, such as bottleneck issues, outdated drivers, corrupted drivers, hardware conflicts, or power-related problems. Any of these can affect GPU performance and stability.
3. DirectX Diagnosis
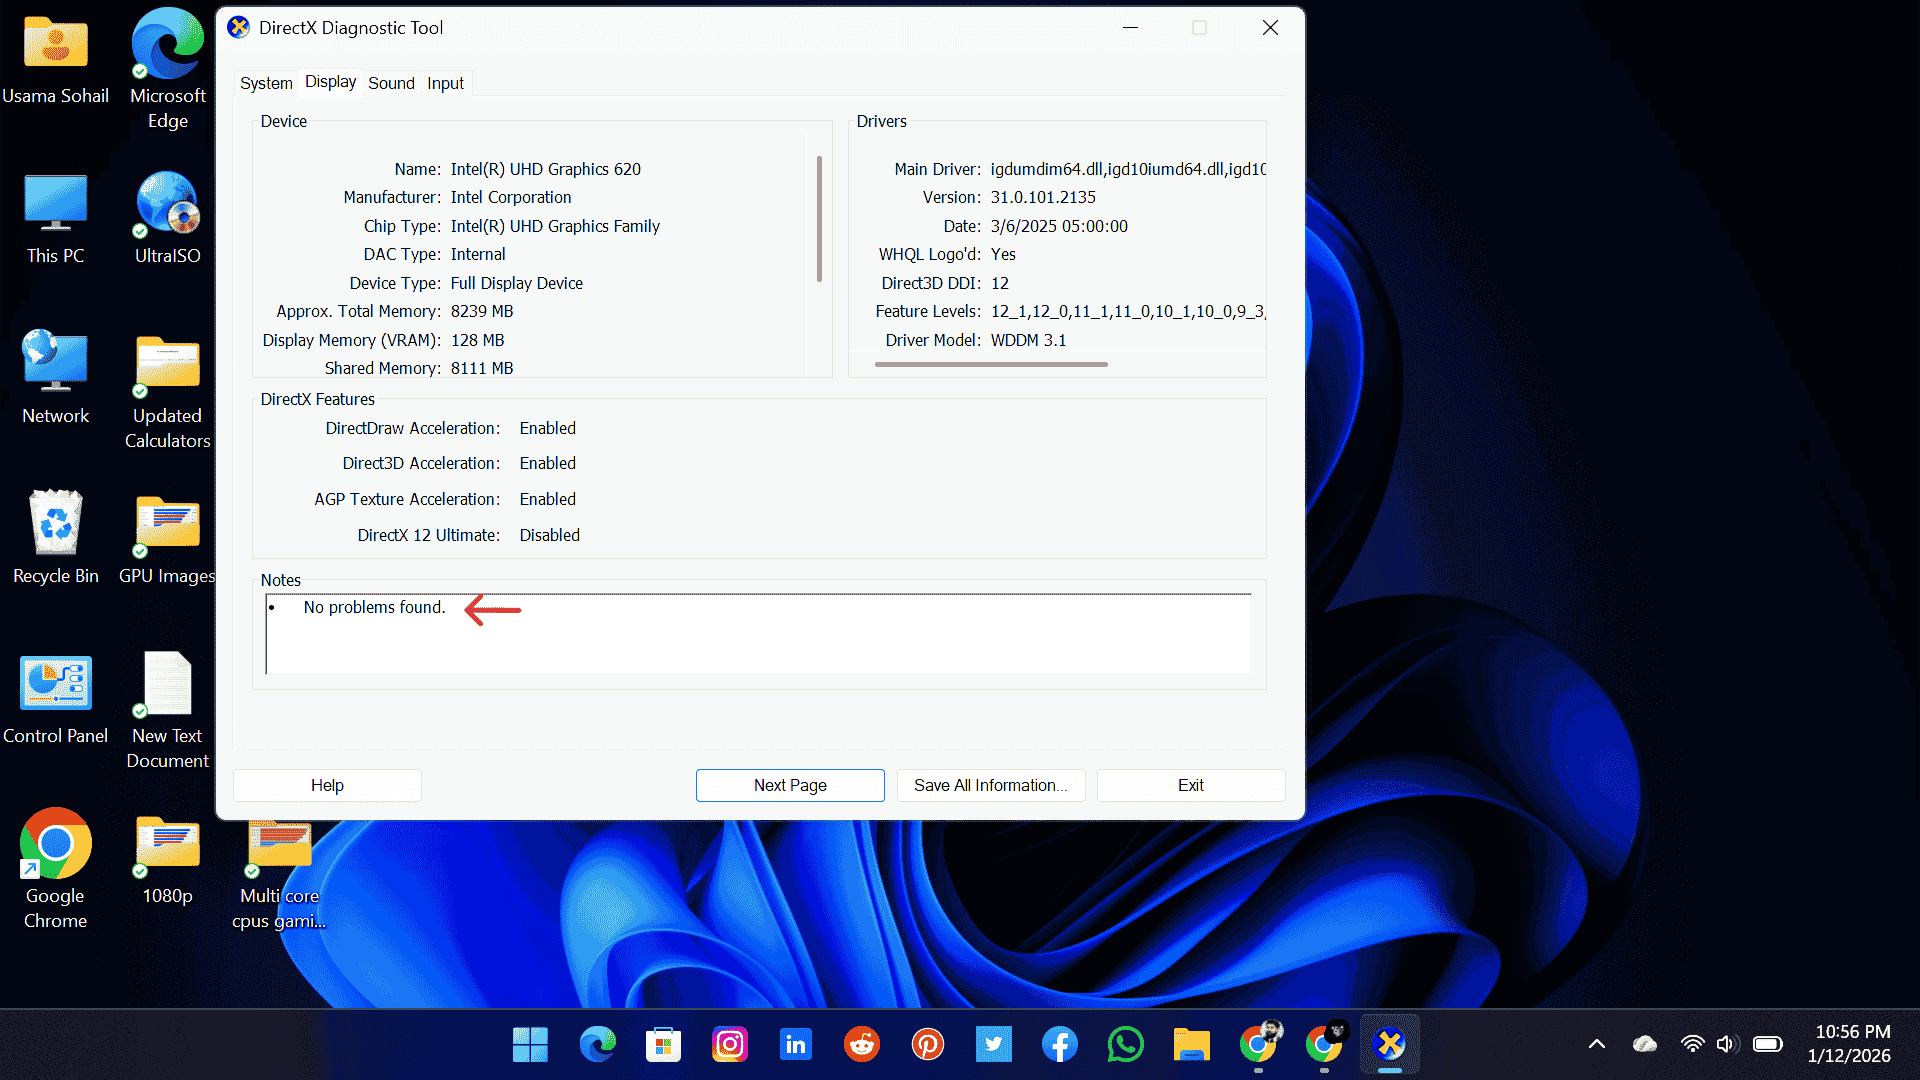
Once it opens, go to the Display tab. Here, you will see complete details about your GPU. At the bottom of this window, you will also find status messages. If everything is working fine, it will usually show that No problems found. This means your GPU is functioning properly.
DirectX Diagnostic Tool does not change your DirectX version, and it does not modify your system files. It only checks your existing graphics setup and, in some cases, supports older game technologies that are already part of Windows.
This method is especially helpful because it checks both hardware and software compatibility at the same time, giving you a clear picture of your GPU’s condition.
Best Tools to Check GPU Health
Windows’ built-in options are good for checking GPU health and its basic activities, but if you want to detect issues related to temperature stability, power behavior, or VRAM, you can deeply analyze your GPU using some trusted online tools. These tools read data directly from hardware sensors, making it easier to understand how the GPU actually behaves, especially during gaming, rendering, or stress-heavy tasks.
1. HWiNFO provides a detailed overview of almost every GPU sensor, including temperatures, voltages, power consumption, and throttling indicators.
2. MSI Afterburner is ideal for checking GPU health and its gaming behaviour, allowing you to track GPU load, temperature, and clock stability while playing.
3. GPU-Z is a lightweight tool that clearly checks GPU health and displays sensor data, PCIe behavior, and signs of thermal throttling.
4. OCCT is more focused on diagnostics and helps detect VRAM errors, power instability, and overall GPU reliability issues.
Laptop vs Desktop GPU Health
Laptop GPUs operate under tighter thermal limits due to restricted airflow and compact cooling systems, which is why they typically run hotter than desktop GPUs. During gaming or heavy workloads, laptop GPUs can safely reach higher temperatures, but only within controlled limits. Because of this thermal behavior, stress testing on laptops should always be short and carefully monitored.
Desktop GPUs, in comparison, benefit from better airflow, larger cooling solutions, and more thermal headroom, allowing them to maintain lower temperatures under load. Cleaning, repasting, and cooling upgrades are also far more accessible on desktop systems, which helps preserve GPU health over longer periods.
| Category | Laptop GPU | Desktop GPU |
|---|---|---|
| Idle Temperature | 40°C – 55°C | 30°C – 45°C |
| Gaming Load | 75°C – 88°C | 60°C – 80°C |
| Stress Testing Limit | Up to 90°C (short duration) | Up to 85°C (short duration) |
| Thermal Headroom | Limited | Higher |
| Cooling Capacity | Compact & restricted | Large & efficient |
| Maintenance Access | Difficult | Easy |
| Long-Term Health Impact | More sensitive to heat | More resilient with airflow |
How to Check GPU VRAM Health?
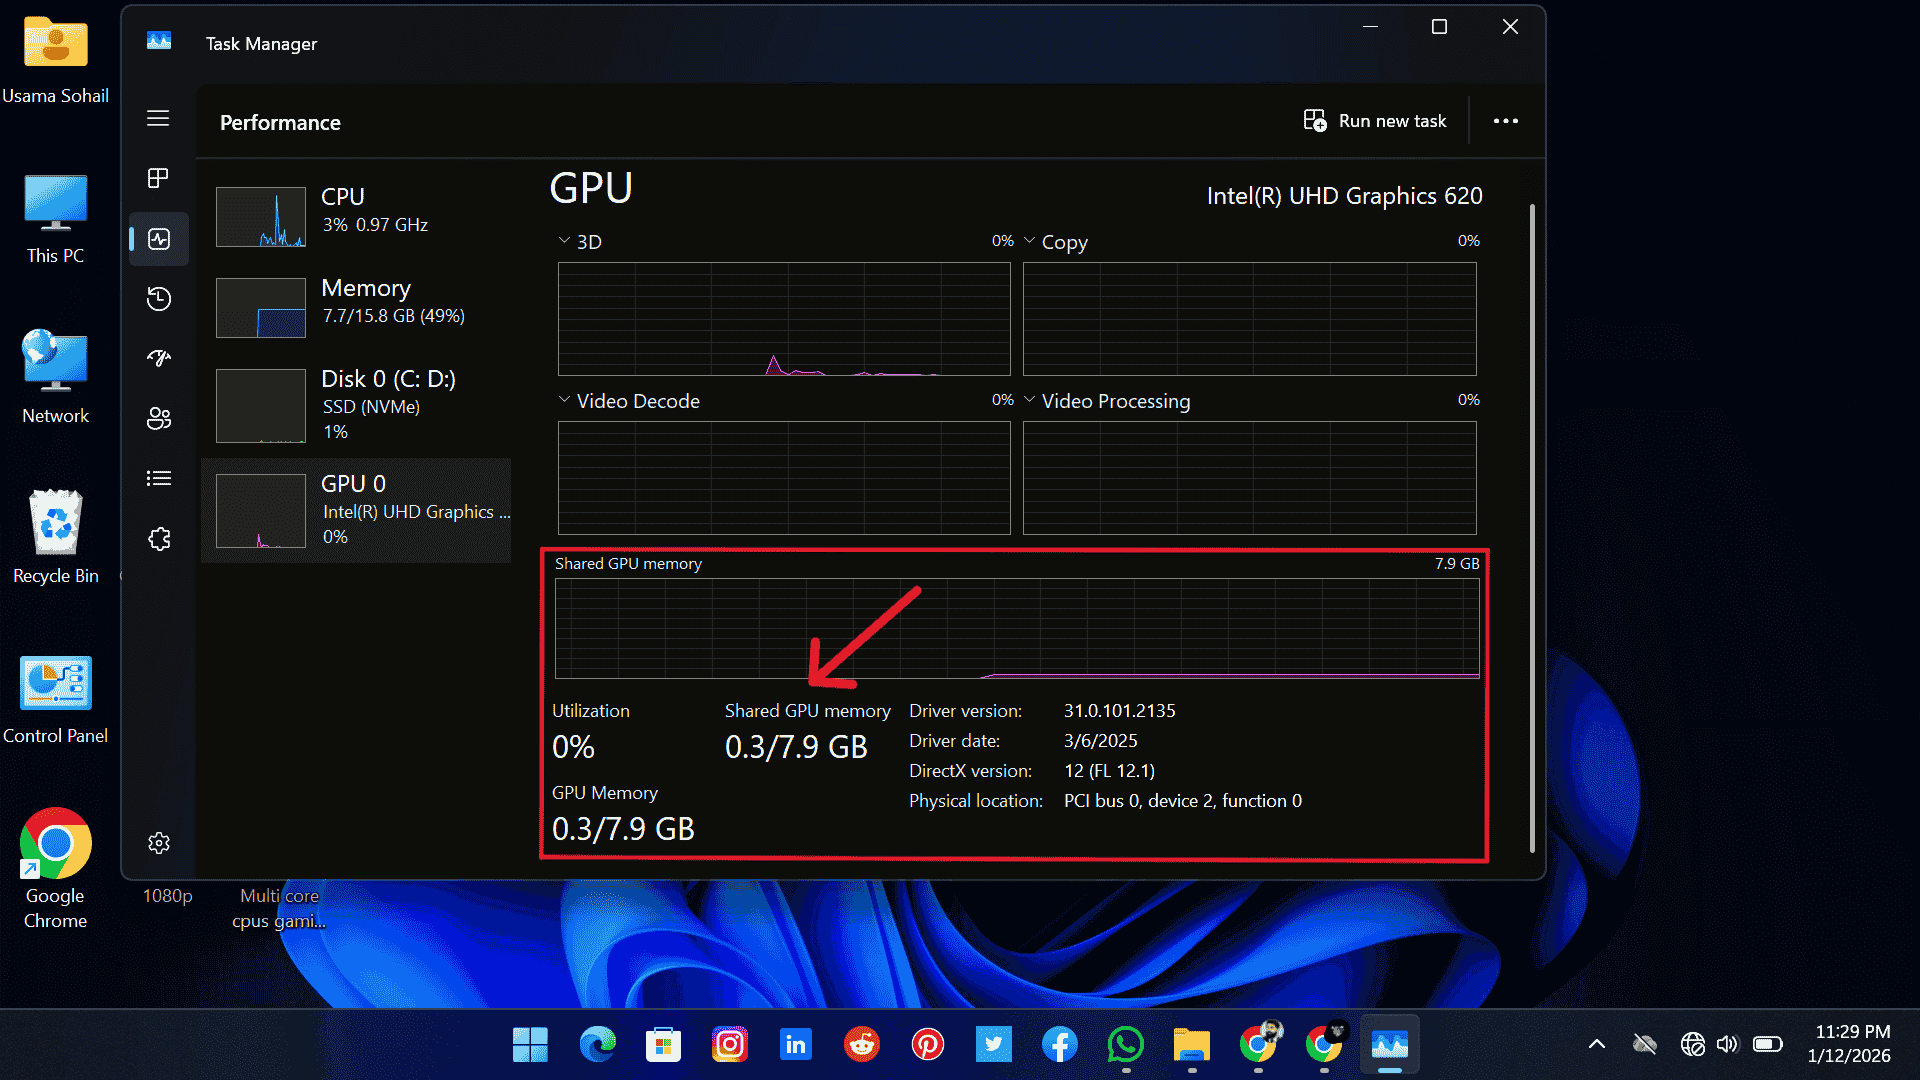
VRAM issues often go unnoticed because they do not always cause system crashes. Many users continue using their GPU without realizing that the memory is slowly failing. The OCCT VRAM test is a reliable tool for detecting memory errors. It checks whether the VRAM is handling data correctly during heavy load.
If the test reports errors, it means the memory cells are not processing data properly, which can lead to stuttering, texture glitches, or performance drops. VRAM degradation is more common in used GPUs and mining GPUs, which is why testing them is especially important before long-term use.
Physical Inspection That Software Can’t Detect
Some GPU problems cannot be found using software, Windows options, or monitoring tools. These issues can only be noticed by checking the graphics card physically. Manual inspection helps you catch early signs of damage before they become serious issues.
Here are the key physical factors you should check manually to keep your GPU in good condition:
Conclusion
GPU health reflects how well your graphics card handles workload while maintaining stable performance, safe temperatures, and error-free operation. When you check GPU health using Windows metrics such as usage, memory activity, clock behavior, and system load, help you understand how your GPU performs under different tasks.
Regular monitoring is essential because ignoring GPU health can allow small issues to grow into serious problems. Over time, this can lead to overheating, crashes, visual glitches, and sudden frame drops, even if the rest of your system continues to work normally.

