CPU Temperature Monitoring | Recommended Software & Hardware Solutions (2026)
If your system suddenly slows without any reason, performance starts fluctuating, you experience BSOD (Blue Screen of Death), or it generates excessive heat even under a light workload, these are signs that your CPU may be overheating. The solution is not always to replace hardware components. Instead, you should monitor your CPU temperature so your system and processor can perform tasks more stably and efficiently. Also, make sure to understand the difference between laptops and desktops. Due to their compact design, laptops are more prone to overheating than desktops.
CPU temperature monitoring means observing and analyzing data from the thermal sensors built inside the processor using different software tools and monitoring utilities. Because hardware monitors have sensors that measure core temperature, package temperature, and thermal margins, which indicate the heat level at which the CPU is operating.
When you have a clear overview of your processor’s temperature, you can improve your cooling system by applying high-quality CPU thermal paste or using a better CPU cooler to maintain stable performance.
Top-Tested CPU Temperature Monitoring Software (2026)
| Tool Name | Monitoring Level | CPU Temperature Type | Remarks |
|---|---|---|---|
| BIOS Hardware Monitor | Firmware-Level (UEFI) | Package / Socket Sensor | Most Accurate |
| HWMonitor | OS-Level Sensor Access | Core + Package | Deep Diagnostics |
| HWiNFO64 | Advanced Sensor-Level | Per-Core + Package + Limits | Safe to use |
| Open Hardware Monitor | Open-Source Controller Access | Core + Package | Top Rated |
| Core Temp | MSR-Level Access | Per-Core + TjMax | CPU Focused |
All the CPU temperature monitoring software we recommend has been properly tested and is safe to use on your system. It will not cause any stability or security issues. We have tested several other tools as well, but due to potential Windows security concerns, we cannot recommend those to our users. CPU temperature monitoring software is also known as a hardware monitoring tool. These tools detect your PC or laptop’s real-time temperature while the system is running.
Below, we have provided detailed information about each CPU temperature monitor, including how to install and use them, how to measure and understand the readings, and how they detect real-time temperature data through built-in hardware sensors.
1. BIOS Hardware Monitor (Top Recommendation)
It is the motherboard’s official hardware monitoring interface and directly reads data from onboard thermal sensors. Unlike external tools, BIOS (Basic Input/Output System) does not depend on Windows services, background processes, or driver layers. It communicates directly with motherboard sensor controllers such as Nuvoton, ITE, or Winbond monitoring chips, which makes it the most trusted low-level temperature reference.
Accessing BIOS is simple, but the key differs depending on your motherboard manufacturer. Restart your system and, during the initial boot screen, press Delete, F2, F10, or Esc depending on your motherboard or laptop manufacturer (commonly ASUS, MSI, Gigabyte, ASRock, Dell, or HP). Once you enter the BIOS/UEFI interface, navigate to the monitoring section.
This is usually found under Hardware Monitor, PC Health Status, H/W Monitor, or System Monitor. In some modern UEFI layouts, you may need to go to Advanced → Monitoring to access detailed temperature and hardware readings. In modern UEFI interfaces (especially ASUS UEFI BIOS Utility or MSI Click BIOS 5), the CPU temperature is often displayed directly on the main dashboard.
Let me explain with an example. In most cases, a commonly working method is to restart your system and press F12 during the boot screen to open the system’s built-in diagnostic menu. From the diagnostic section, select Processor Diagnostics.
Once you open the processor diagnostics, you will see the stress test options. The system allows you to choose the test duration — typically 15 minutes, 20 minutes, or 30 minutes. Select any duration according to your requirement and click Start to begin the stress test.
As soon as the test starts, the processor will be placed under load, and the system will begin monitoring temperature and performance behavior. As you can see in this image, the live readings are displayed while the stress test is running.
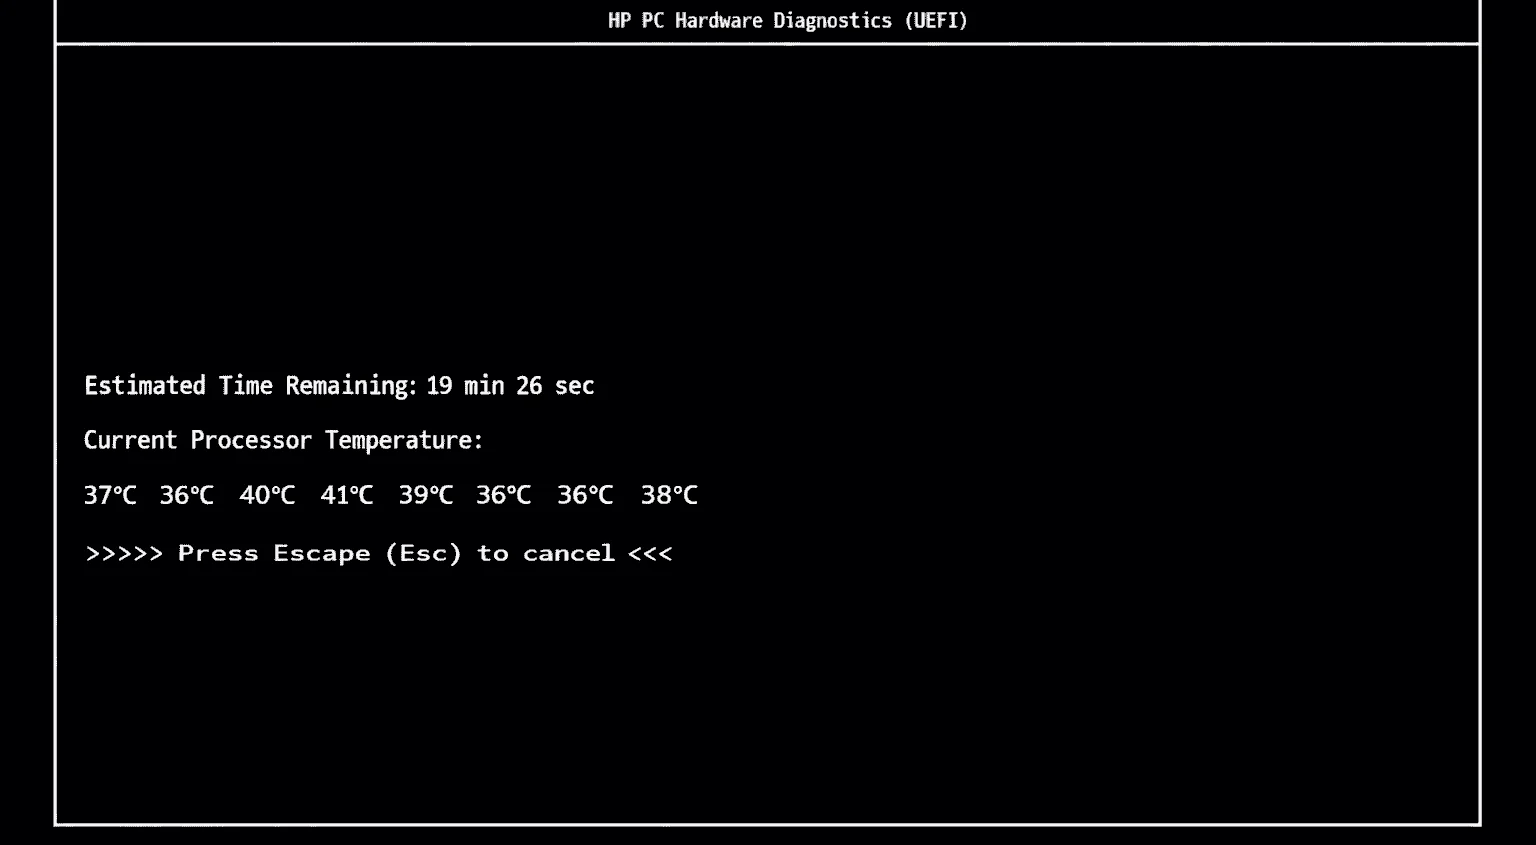
The stress test will automatically stop once the selected duration is completed. However, if needed, you can manually stop the test by selecting the End Test or Stop option.
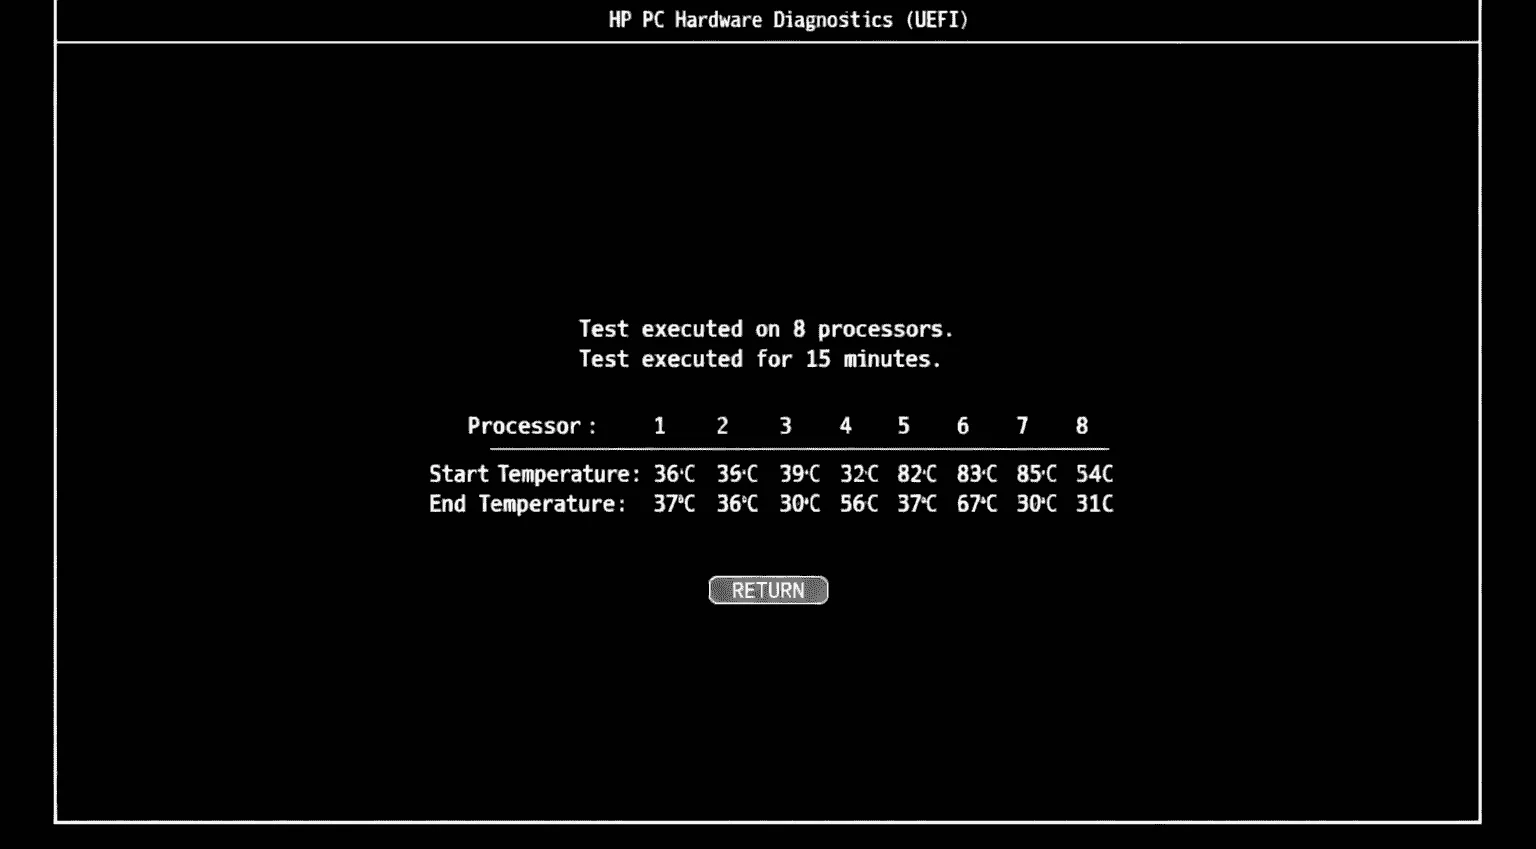
After the stress test finishes, the system displays the final results, including the starting temperature and the ending temperature. The starting temperature shows the CPU reading before the stress test began, while the ending temperature reflects the maximum temperature reached under load. As you can see in this image, both values are clearly shown for comparison.
2. HWMonitor
HWMonitor is a lightweight CPU temperature monitoring hardware that presents system health data in a structured and readable way. It automatically detects system sensors and displays CPU, GPU, storage, battery, and network-related values without requiring manual setup.
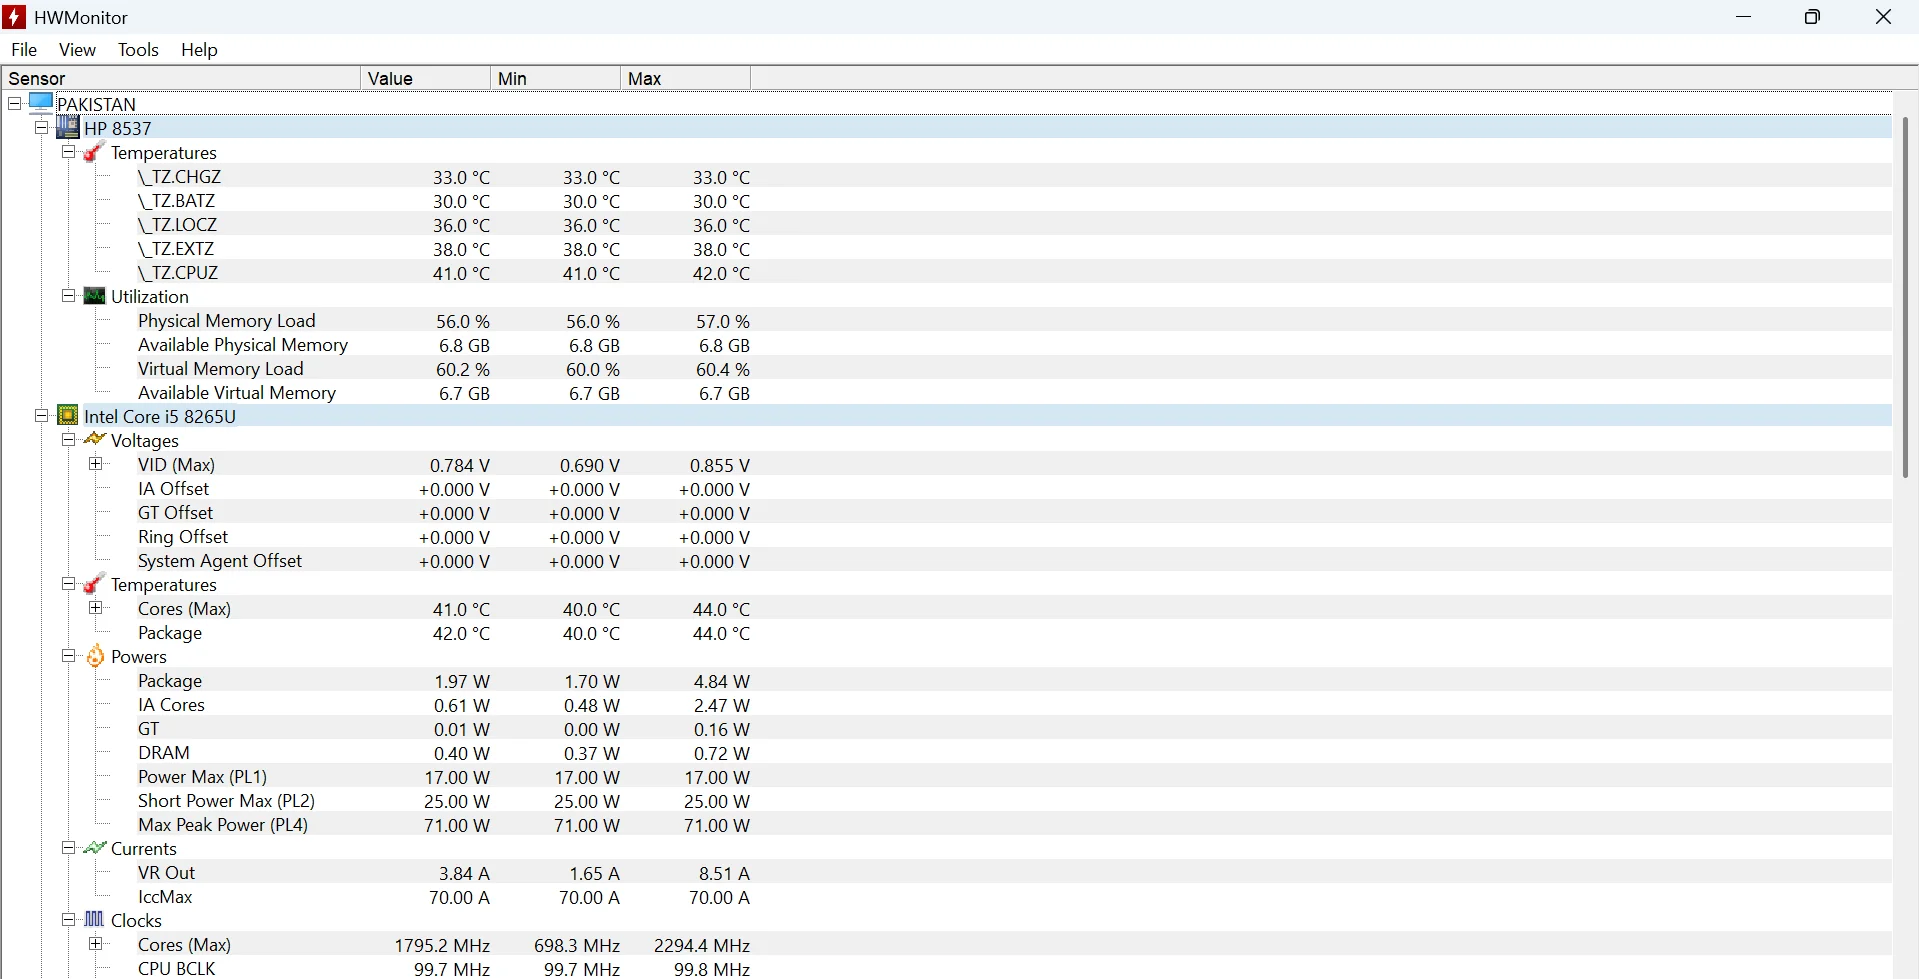
CPU temperature readings are taken directly from Intel’s on-chip thermal sensors, showing core-level and package temperatures along with minimum and maximum values. In the observed system, the Intel Core i5-8265U maintained stable temperatures in the low-40°C range during normal background usage, which is consistent with expected mobile processor behavior.
One distinct aspect of HWMonitor is how it reports CPU activity. The software may display values above 100%, which reflects turbo boost and dynamic frequency scaling rather than a reporting error. Unlike Windows Task Manager, which limits usage to 100%, HWMonitor keeps the raw value visible to show how clock increases affect actual processor activity. This approach provides clearer insight into performance behavior under changing workloads.
The clock section marks certain cores with an asterisk, identifying the fastest cores available on the processor. These cores are designed to reach slightly higher frequencies, explaining minor differences in clock values during operation. Power data, such as CPU package power, IA cores, GT, and DRAM consumption, is shown separately, allowing users to understand how power is distributed across different CPU components.
Graphics monitoring includes temperature, clock state, and utilization. In the provided system state, Intel UHD Graphics 620 remained at low usage with normal operating temperatures, which matches idle or light desktop activity. Storage monitoring relies on S.M.A.R.T. data, presenting disk usage, activity levels, and health indicators in a clear format. Battery information is also detailed, showing design capacity, current capacity, wear level, and charge percentage, which helps evaluate long-term battery condition rather than just remaining charge.
3. HWiNFO64 Hardware Monitor
HWiNFO64 is a trusted CPU temperature monitoring tool that reads CPU temperatures directly from the on-chip Digital Thermal Sensors (DTS). When the software is running, it accurately displays the temperature of each processor core, the overall CPU package temperature, core clock speeds, voltage (Vcore), power consumption, and thermal limits.
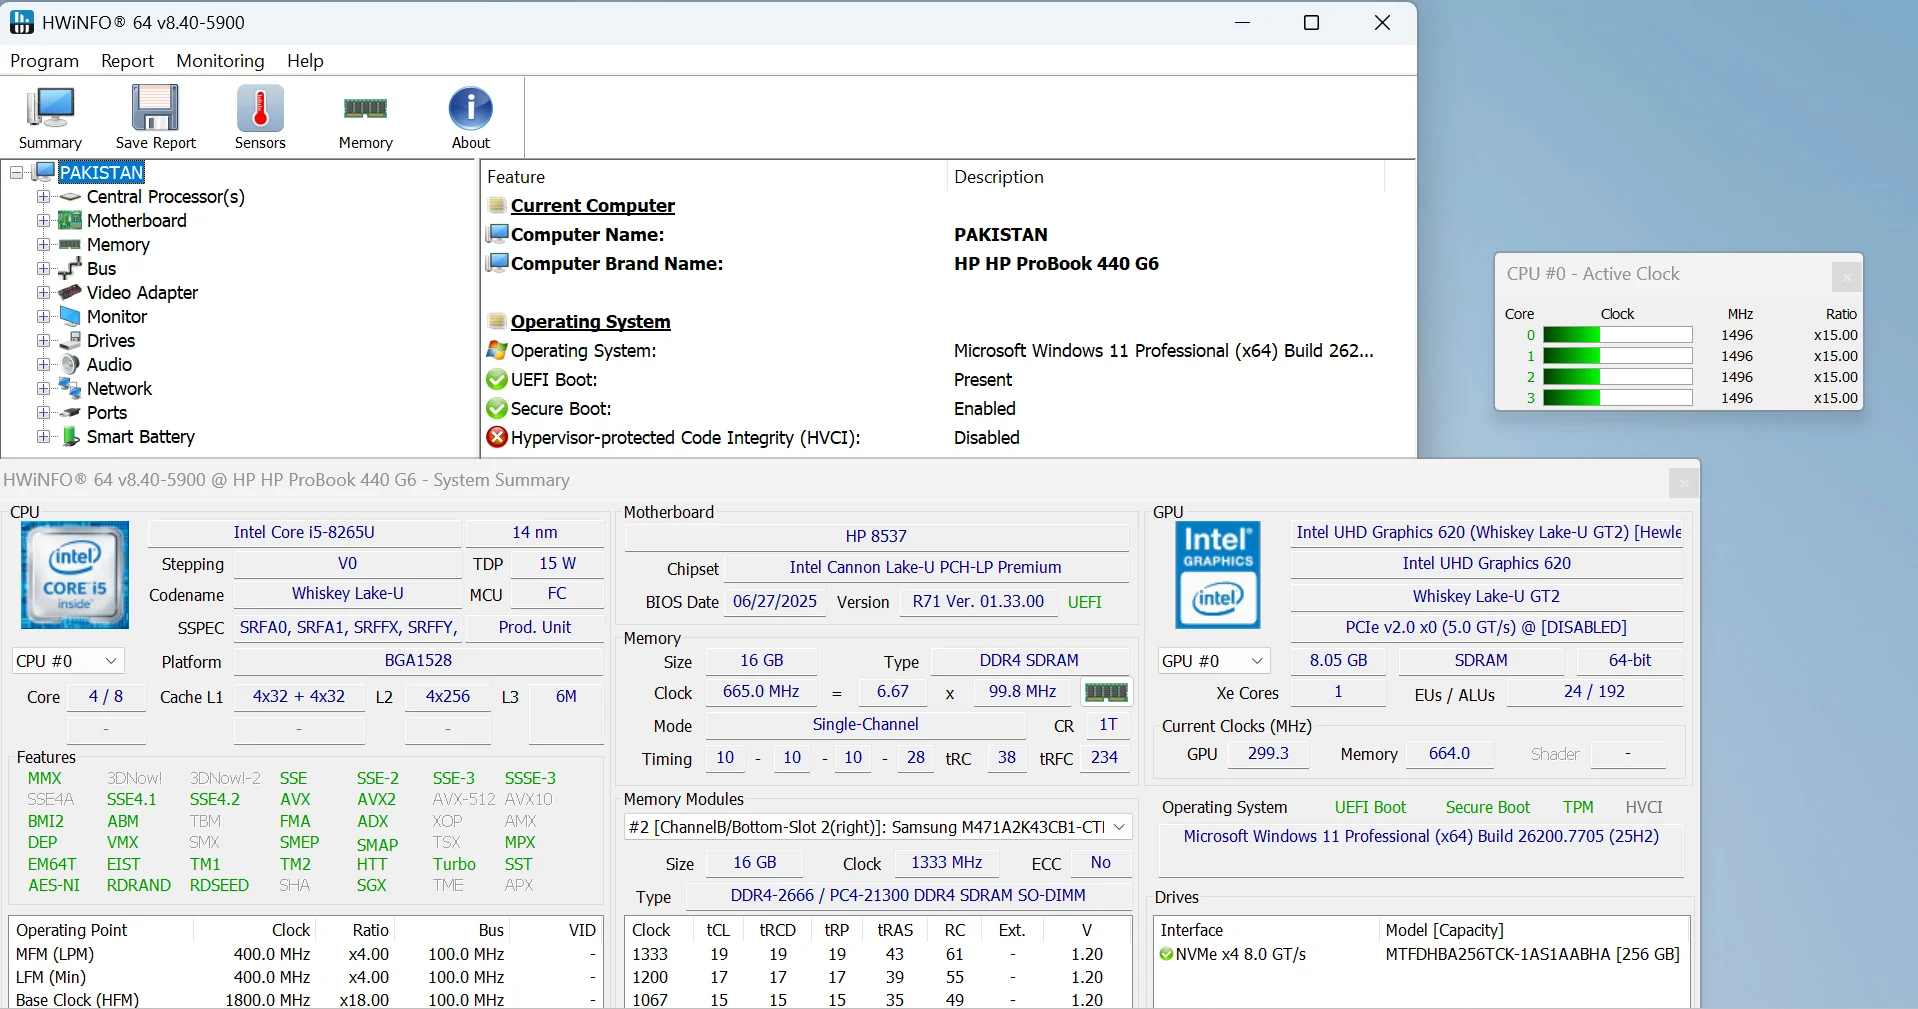
Its Sensors panel shows temperature fluctuations, allowing a clear comparison between idle and load conditions. Reading CPU temperatures provides insight into heat distribution and helps diagnose potential overheating issues.
HWiNFO64 has no reported security issues and is fully compatible with Windows. The software uses Windows’ standard hardware access protocols and driver interfaces to read data from the system’s built-in thermal sensors without making any unauthorized modifications to the system.
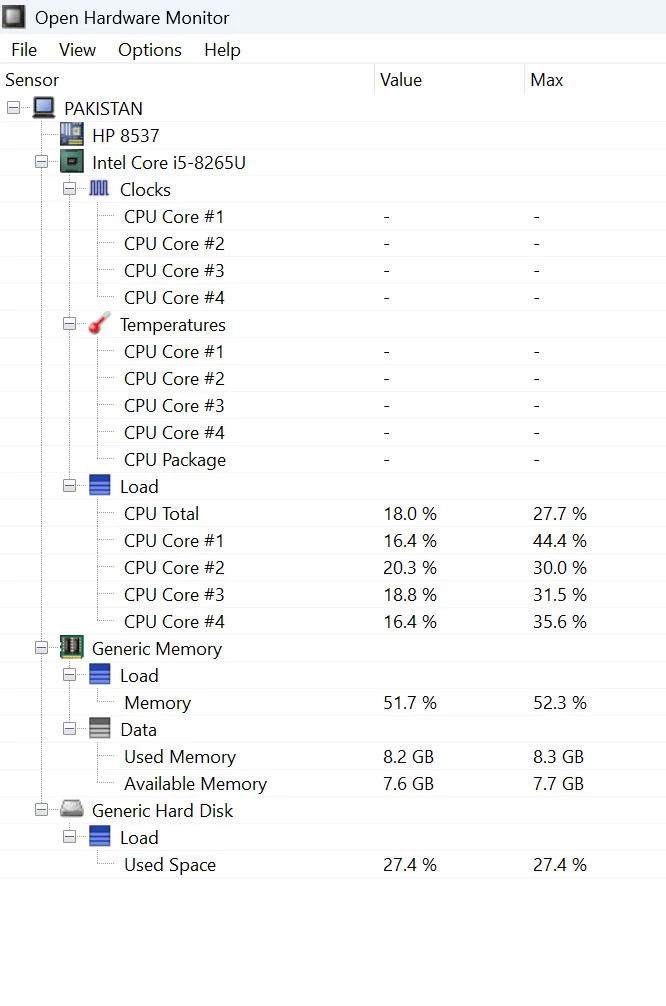
4. Open Hardware Monitor
Open Hardware Monitor is a free, open-source utility that helps users check the health and behavior of their computer hardware. It reads CPU temperatures, clock speeds, voltage levels, and workload directly from supported Intel and AMD processors.
The software also communicates with common motherboard sensor chips from manufacturers such as ITE, Fintek, Nuvoton, and Winbond, which allows it to display fan speeds, voltage rails, and board-level temperature data.
Graphics card monitoring is available for both Nvidia and AMD GPUs, while storage drives are checked using S.M.A.R.T. data to show temperature and basic activity. All collected sensor values are exposed through Windows Management Instrumentation (WMI), making the data accessible to other tools or scripts if needed.
Open Hardware Monitor runs without installation on multiple operating systems, including Windows XP through Windows 10 (both 32-bit and 64-bit), and it also supports x86-based Linux systems, which makes it practical for quick checks, diagnostics, and general system monitoring.
5. Core Temp Hardware Monitor
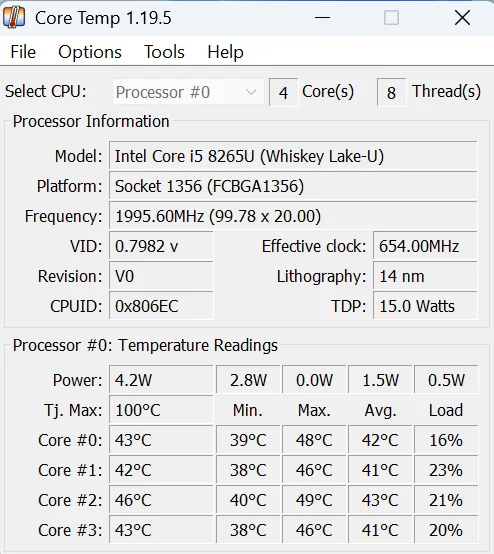
Core Temp is a dedicated CPU thermal monitoring utility that accesses Model-Specific Registers (MSRs) through Windows’ hardware abstraction layer, where the CPU stores its internal thermal readings.
Every modern Intel processor has a calibrated thermal sensor that continuously monitors the core temperature and compares it against the TjMax (Thermal Junction Maximum) reference. Core Temp interprets this raw sensor data and displays it in a readable °C format.
Why is monitoring CPU Temperature Is Important?
Monitoring CPU temperature is important because a processor can only perform efficiently within a specific temperature range. For example, a modern CPU typically works smoothly when its temperature stays around 35–70°C, handling daily tasks and heavy workloads without issues.
However, when the CPU temperature rises beyond safe limits, the processor begins to protect itself by reducing clock speeds, a behavior known as thermal throttling. This directly affects system performance, causing slower response times, reduced processing power, and unstable behavior during demanding tasks. If high temperatures persist, they can place long-term stress on internal components, leading to faster hardware wear and potential system shutdowns.
By regularly monitoring CPU temperature, users can identify overheating early and apply solutions such as improving airflow, upgrading cooling systems, or adjusting workloads. This proactive approach helps prevent thermal throttling, maintain consistent performance, and extend the overall lifespan of PC hardware.
How Can You Cool Your CPU?
Top Intel & AMD CPUs Temperature Limits 2026
| CPU Models | Ideal Temp 🟢 (°C) | Safe Load Temp 🟡 (°C) | Max Tolerable 🔴 (°C) |
|---|---|---|---|
| Core i9-14900K | 35–55 | 55–80 | 100 |
| Core i9-13900K | 35–55 | 55–85 | 100 |
| Core i9-13900KF | 35–55 | 55–85 | 100 |
| Core i9-13900 | 35–55 | 55–80 | 100 |
| Core i9-12900K | 35–55 | 55–85 | 100 |
| Core i9-12900KF | 35–55 | 55–85 | 100 |
| Core i9-11900K | 35–55 | 60–85 | 100 |
| Core i9-10900K | 35–55 | 60–85 | 100 |
| Core i7-14700K | 35–55 | 55–80 | 100 |
| Core i7-13700K | 35–55 | 55–85 | 100 |
| Core i7-13600K | 35–55 | 55–80 | 100 |
| Core i7-12700K | 35–55 | 55–80 | 100 |
| Core i7-11700K | 35–55 | 60–80 | 100 |
| Core i7-9700K | 35–55 | 55–80 | 100 |
| Core i5-14600K | 30–50 | 50–80 | 100 |
| Core i5-13600K | 30–50 | 50–80 | 100 |
| Core i5-13600KF | 30–50 | 50–80 | 100 |
| Core i5-12600K | 30–50 | 50–75 | 100 |
| Core i5-10400 | 30–50 | 50–75 | 100 |
| Core i3-12100 | 30–45 | 45–70 | 100 |
| Pentium G-Series | 30–45 | 45–70 | 90–100 |
| Xeon W-2295 | 35–55 | 55–80 | 100 |
| Core Ultra 9 285K | 35–55 | 55–75 | 105* |
| Ryzen 9-9950X | 35–55 | 55–80 | 95 |
| Ryzen 9-7950X | 35–55 | 55–85 | 95 |
| Ryzen 9-7900X | 35–55 | 55–85 | 95 |
| Ryzen 9-7950X3D | 35–55 | 55–80 | 89* |
| Ryzen 7-7800X | 35–55 | 55–80 | 95 |
| Ryzen 7-7700X | 35–55 | 55–80 | 95 |
| Ryzen 7-7800X3D | 35–55 | 55–80 | 89* |
| Ryzen 7-5800X | 35–55 | 55–80 | 95 |
| Ryzen 5-7600X | 30–50 | 50–75 | 95 |
| Ryzen 5-5600X | 30–50 | 50–75 | 95 |
| Ryzen 5-3600 | 30–50 | 55–75 | 95 |
| Ryzen 3-3100 | 30–45 | 45–70 | 95 |
| Ryzen TD 9990WX | 35–55 | 55–85 | 95 |
| EPYC 7742 | 35–55 | 55–85 | 95 |
| EPYC 9654 | 35–55 | 55–85 | 95 |
Conclusion
CPU temperature monitoring helps you understand how your system behaves under real working conditions. By checking temperatures through hardware monitors such as the BIOS or trusted tools that read data directly from CPU and motherboard sensors, you can identify overheating early and prevent slowdowns, crashes, or long-term hardware damage.
Regularly monitoring CPU temperature and addressing issues with proper cooling, airflow, or basic maintenance allows the processor to operate as intended, particularly in systems used for gaming, heavy workloads, or extended usage sessions.

