
How to Scale SaaS Applications by Identifying System Bottlenecks?
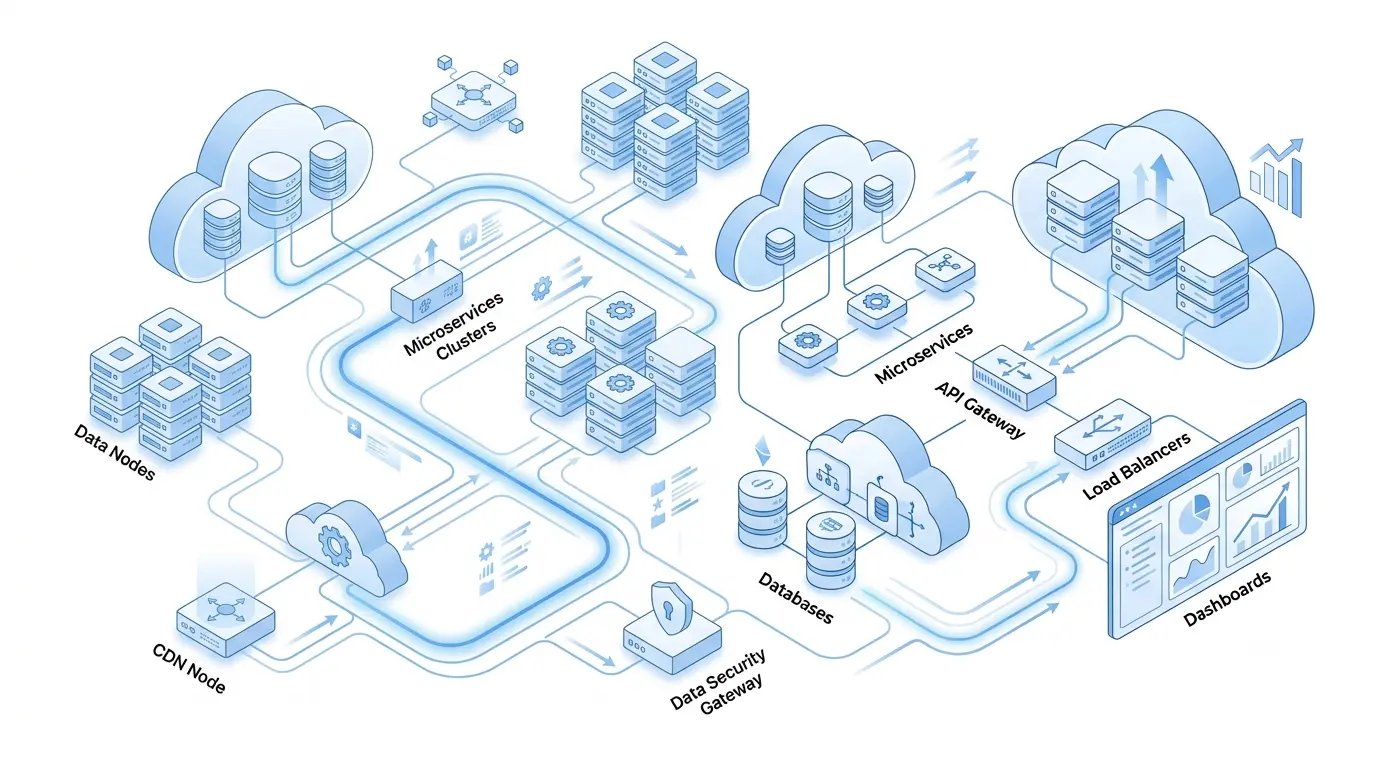
Every software system has a limit. A SaaS application may perform smoothly when serving a few hundred users but begin responding slowly as traffic, data volume, and background processes increase. These slowdowns are not always caused by insufficient computing resources. More often, they occur because one part of the architecture cannot keep pace with the rest of the system. This limiting component is known as a bottleneck.
The same principle applies to computer hardware. For example, pairing a high-performance graphics card with an older processor prevents the GPU from reaching its full potential because the CPU cannot prepare data quickly enough. Although modern SaaS platforms operate on distributed cloud infrastructure rather than a single machine, the underlying concept remains the same. The overall performance of the application depends on how efficiently every layer works together.
Unlike desktop hardware, software architectures contain many interconnected components. A single user request may pass through a load balancer, API gateway, authentication service, application server, cache, database, third-party APIs, and background workers before a response is returned. This level of complexity is common in modern enterprise AI solutions, where multiple services work together to process data, automate decisions, and deliver intelligent features. Even if most of these components perform well, one overloaded service can delay the entire request. As traffic grows, these delays often spread across multiple services, reducing responsiveness for every user connected to the platform.
Identifying these limitations requires more than monitoring CPU or memory usage. Modern engineering teams analyze response times, database performance, network latency, request queues, cache efficiency, and application logs to determine where requests spend the most time. Measuring these factors allows teams to address the actual source of performance degradation instead of upgrading infrastructure without evidence.
Common Bottlenecks in SaaS Platforms
Modern SaaS application development consists of multiple services working together to process every request. As user traffic grows, weaknesses in one layer can gradually affect the entire application. Some bottlenecks become visible only during peak traffic, while others remain hidden until the database grows, new features are added, or third-party integrations increase. Understanding how these bottlenecks develop helps engineering teams resolve performance issues before they impact users.
Database Bottlenecks
The database is one of the most common sources of performance problems because almost every application depends on it. User accounts, product information, transactions, application settings, and activity logs are all stored in databases. As data volume increases, queries that once completed within milliseconds may take much longer to execute if the database is not properly optimized.
One of the primary causes of database bottlenecks is inefficient indexing. A database index works much like the index of a book. Instead of scanning every page to locate information, the database can directly navigate to the required records. Without appropriate indexes, queries often perform full table scans, reading every row before finding the requested data. On small datasets, this delay may be insignificant, but on tables containing millions of records, it can dramatically increase response times.
Poor query design also contributes to database performance issues. Queries that retrieve unnecessary columns, perform multiple nested joins, or repeatedly execute inside application loops consume more processing power than required. A common example is the N+1 query problem, where an application retrieves a list of records and then performs an additional query for every individual record. Instead of executing two or three optimized queries, the application may send hundreds of database requests for a single page, placing unnecessary load on the server.
Write-heavy workloads introduce another challenge. E-commerce platforms, financial systems, and analytics applications continuously insert and update records. As concurrent write operations increase, database locks can delay other transactions while maintaining data consistency. If many users attempt to modify the same records simultaneously, waiting transactions accumulate, increasing latency across the application.
Connection pool exhaustion is another frequently overlooked issue. Rather than creating a new database connection for every request, applications maintain a pool of reusable connections. If all available connections become occupied, new requests must wait until an existing connection is released. Even a powerful database server can appear slow when connection limits are reached.
Engineering teams address these challenges through a combination of query optimization, proper indexing, connection pooling, database replication, and caching. For applications with rapidly growing datasets, techniques such as partitioning and sharding distribute data across multiple storage units, allowing the workload to be shared instead of concentrated on a single database instance.
API Bottlenecks
Application Programming Interfaces (APIs) allow different services to communicate with one another. In a modern SaaS environment, a single user request often triggers several API calls before a response is generated. While APIs make software modular and easier to maintain, they also introduce additional latency because every request requires network communication, processing time, and response validation.
A common issue occurs when services depend on synchronous communication. In this model, one service cannot continue processing until another service returns a response. If the dependent service experiences delays, every waiting request becomes slower. When several services depend on each other in sequence, latency accumulates throughout the request path.
Large response payloads can further increase processing time. APIs sometimes return entire datasets even when the client only needs a few fields. Larger payloads consume additional network bandwidth, increase serialization and deserialization time, and require more memory during processing. Reducing unnecessary data transfer helps improve response times while lowering infrastructure costs.
Improper timeout and retry configurations also contribute to performance degradation. When an external API becomes unavailable, applications may repeatedly retry failed requests before returning an error. Although retries help recover from temporary network failures, excessive retry attempts increase server load and delay responses for other users. Intelligent retry policies, exponential backoff strategies, and circuit breaker patterns help prevent these cascading failures.
Rate limiting presents another challenge for SaaS applications that rely on third-party providers. This is particularly important for platforms such as procurement analytics software, where large volumes of supplier, inventory, and purchasing data may be exchanged through external APIs. Services such as payment gateways, mapping platforms, email providers, and AI APIs often restrict the number of requests allowed within a specific period. This can become a significant challenge for platforms that depend on AI automation, where continuous communication between multiple services is required to process tasks efficiently. Exceeding these limits can delay or reject requests entirely. Caching frequently requested information and reducing unnecessary API calls help minimize these limitations.
Cache Bottlenecks
Caching is one of the most effective techniques for reducing application latency because retrieving data from memory is significantly faster than querying a database. Frequently accessed information such as user profiles, product catalogs, application settings, and session data can often be served directly from a cache instead of repeatedly accessing persistent storage.
However, poorly designed caching strategies can introduce their own bottlenecks. A low cache hit rate means most requests still reach the database, providing little performance improvement while adding another infrastructure component to maintain. This situation often occurs when cache expiration periods are too short or when applications store data that is rarely requested again.
Another common issue is cache invalidation. Cached information must remain synchronized with the underlying database. If stale data remains in memory after records are updated, users may receive outdated information. Conversely, invalidating the cache too frequently reduces its effectiveness because the application repeatedly rebuilds cached data instead of serving existing entries.
A cache stampede can occur when a popular cached item expires. Instead of one request rebuilding the cache, hundreds or thousands of simultaneous requests attempt to retrieve the same data directly from the database. This sudden spike can overwhelm the database and create significant delays. Many distributed caching systems prevent this by allowing only one request to regenerate the cache while temporarily serving previous values or delaying additional requests.
Memory allocation also requires careful planning. Since cache servers store data in memory, inefficient cache management can consume large amounts of RAM without providing meaningful performance improvements. Regular monitoring of cache hit ratios, eviction rates, memory usage, and response times helps ensure the cache remains an effective optimization layer rather than another source of system overhead.
Background Worker Bottlenecks
Not every operation should be completed while a user waits for a response. Tasks such as generating reports, resizing uploaded images, processing videos, sending invoices, delivering emails, or synchronizing data with external systems usually run in the background. These operations are placed into message queues where worker processes execute them independently from user requests.
Background processing improves application responsiveness, but it also introduces new performance considerations. If jobs enter the queue faster than workers can process them, the backlog continues to grow. As waiting times increase, users may experience delayed notifications, incomplete reports, or slow data synchronization even though the application’s primary interface remains responsive.
The complexity of background tasks also affects processing speed. Some jobs complete within a few milliseconds, while others require extensive computation or communication with external services. Mixing lightweight and resource-intensive jobs in the same queue can delay smaller tasks because they remain blocked behind long-running operations. Separating workloads into dedicated queues allows worker resources to be allocated more efficiently.
Failures during background processing require careful handling as well. Temporary network issues, unavailable third-party services, or unexpected application errors can cause jobs to fail repeatedly. Instead of retrying indefinitely, many systems move unsuccessful jobs into dead-letter queues where engineers can investigate and resolve the underlying issue without disrupting normal processing.
Network Bottlenecks
Even well-optimized applications can experience performance issues if network communication becomes a limiting factor. Every interaction between clients, application servers, databases, cloud storage, and third-party services depends on network connectivity. As distributed architectures expand across multiple regions and cloud providers, network efficiency becomes increasingly important.
Network latency measures the time required for data to travel between systems. Although each request may require only a few milliseconds, applications often perform dozens of network operations while processing a single user request. These delays accumulate quickly, particularly when services communicate sequentially instead of independently.
Bandwidth limitations affect applications that transfer large files, images, videos, or analytical datasets. When available bandwidth is insufficient, data transmission slows regardless of how powerful the servers may be. Content Delivery Networks (CDNs), compression techniques, and optimized file formats help reduce the amount of data transmitted across the network.
Domain Name System (DNS) lookups, Transport Layer Security (TLS) handshakes, and packet retransmissions also contribute to overall latency. While each process is necessary for secure communication, poorly configured infrastructure or unstable network conditions can increase connection establishment time before any application data is exchanged.
Applications that communicate across geographically distant cloud regions may experience additional delays because every request travels longer physical distances. Deploying services closer to users, optimizing routing strategies, and reducing unnecessary cross-region communication help improve response times for globally distributed applications.
Unlike CPU or memory utilization, network bottlenecks often remain hidden because infrastructure appears healthy while requests continue to experience delays. Comprehensive network monitoring, distributed tracing, and latency analysis help engineering teams identify communication issues before they become widespread performance problems.
The bottlenecks discussed above rarely occur in isolation. A slow database can increase API response times, delayed APIs can create longer background queues, and growing queues may consume additional computing resources that eventually affect other services. For this reason, diagnosing SaaS performance requires examining the complete architecture rather than focusing on a single component. The next step is understanding how engineering teams measure these bottlenecks using performance metrics instead of assumptions.
Measuring Bottlenecks
Performance optimization should always begin with measurement rather than assumptions. A slow application does not automatically indicate a weak server or insufficient computing resources. The actual problem may originate from inefficient database queries, network delays, excessive API calls, overloaded background workers, or poor cache performance. Upgrading hardware without identifying the source of the slowdown often increases infrastructure costs while leaving the underlying issue unresolved.
Engineering teams rely on performance metrics to understand how different parts of the application behave under varying workloads. These measurements provide objective data that helps determine where requests spend the most time and which component is preventing the system from scaling efficiently.
Response Time and Latency
Response time represents the total duration between a user sending a request and receiving a complete response. Since every request passes through multiple services, response time reflects the combined processing time of the entire request path rather than the speed of a single server.
Average response time provides a general overview but rarely tells the complete story. Averages can hide performance issues because a large number of fast requests may offset a smaller number of extremely slow ones. For example, if most users receive responses within 100 milliseconds while a small percentage wait several seconds, the average may still appear acceptable even though many users experience poor performance.
For this reason, engineering teams monitor percentile latency instead of relying solely on averages.
| Metric | What It Represents | Why It Matters |
|---|---|---|
| P50 | Median response time | Shows the experience of a typical user. |
| P95 | 95% of requests complete within this time | Identifies delays affecting a noticeable portion of users. |
| P99 | 99% of requests complete within this time | Reveals the slowest requests that often indicate hidden bottlenecks. |
Suppose an application reports an average response time of 180 milliseconds. At first glance, performance appears healthy. However, if the P99 latency reaches four seconds, a portion of users are consistently experiencing significant delays. Investigating only the average would fail to reveal this problem.
Tracking latency percentiles over time also helps engineering teams identify gradual performance degradation. As user traffic increases, P95 and P99 values often rise before average response times change significantly, making them useful early indicators of scalability issues.
Throughput
Throughput measures how much work an application completes within a specific period. It is commonly expressed as requests per second (RPS), transactions per second (TPS), or processed jobs per minute.
A system capable of processing 500 requests per second may perform efficiently under normal traffic. However, if demand suddenly increases to 900 requests per second without additional capacity, incoming requests begin waiting in queues. This increases response time even though the application continues processing requests successfully.
Monitoring throughput helps determine whether an application has sufficient processing capacity for expected workloads. It also allows engineering teams to evaluate the impact of architectural improvements by comparing request handling capacity before and after optimization.
Error Rate
Not every performance issue results in slower response times. Sometimes services become overloaded and begin rejecting requests altogether.
The error rate measures the percentage of failed requests returned by the application. These failures may include server errors, timeout exceptions, unavailable dependencies, authentication failures, or database connection problems.
A sudden increase in error rates often indicates that one component has reached its operational limit. For example, a database may exhaust available connections, an external API may become unavailable, or background workers may fail while processing queued jobs.
Even small increases in error rates deserve investigation because repeated failures often trigger additional retries from clients, creating even more traffic and placing additional pressure on already overloaded services.
CPU Utilization
The processor performs calculations required to execute application logic, process requests, encrypt data, compress responses, and perform background computations.
Consistently high CPU utilization may indicate that application servers are processing more requests than they can efficiently handle. However, high CPU usage alone does not always represent a problem. Some workloads, such as data analysis or image processing, naturally consume more processing power.
The more important observation is whether CPU utilization remains elevated while response times continue increasing. If both metrics rise together, additional application instances, code optimization, or workload distribution may be necessary.
Conversely, low CPU utilization combined with slow response times often suggests that another component, such as the database or network, is delaying request processing.
Memory Utilization
Memory stores application data currently being processed. Insufficient available memory forces applications to retrieve data from slower storage or causes the operating system to move memory pages between RAM and disk, increasing latency.
Memory leaks represent another common challenge. These occur when applications continue allocating memory without releasing unused resources. Initially, the application appears healthy, but memory consumption gradually increases until performance deteriorates or the process terminates unexpectedly.
Monitoring memory usage over extended periods helps identify abnormal growth patterns that may not appear during short performance tests.
Engineering teams also monitor garbage collection activity in managed programming environments. Excessive garbage collection pauses can temporarily interrupt application processing, increasing latency even when CPU utilization appears normal.
Database Performance Metrics
Because databases serve as the primary storage layer for most SaaS platforms, monitoring database-specific metrics is essential.
Query execution time reveals how long database operations require to complete. Slow queries often indicate missing indexes, inefficient joins, or unnecessary table scans.
Connection pool utilization shows how many active database connections are currently in use. If available connections become exhausted, new requests remain blocked until existing connections are released.
Engineers also monitor transaction rates, lock contention, replication delay, storage utilization, and input/output operations. These metrics provide insight into whether the database itself is approaching its operational limits or whether application-level optimizations can resolve the issue.
Rather than examining individual queries in isolation, engineering teams analyze overall database behavior to identify recurring performance patterns under production workloads.
Cache Performance
Caching reduces database traffic by serving frequently requested information directly from memory. The effectiveness of a cache depends primarily on its hit ratio.
A cache hit occurs when requested data already exists in memory and can be returned immediately. A cache miss requires the application to retrieve information from the database before storing it in the cache for future requests.
A high cache hit ratio indicates that the cache is reducing database workload effectively. Conversely, frequent cache misses increase database traffic and reduce the benefits of caching.
Additional metrics such as cache eviction frequency, memory utilization, and lookup latency help engineers determine whether cache capacity or expiration policies require adjustment.
Queue Depth and Processing Time
Applications using background workers should continuously monitor queue health.
Queue depth represents the number of pending jobs waiting to be processed. A steadily increasing queue usually indicates that incoming tasks exceed worker capacity.
Average processing time measures how long workers require to complete each job. If processing time increases while queue depth continues growing, users may experience delays in receiving emails, notifications, reports, or synchronized data.
Tracking retry attempts and failed jobs provides additional insight into processing reliability. Repeated failures often point to application bugs, unavailable dependencies, or resource limitations that require further investigation.
Distributed Tracing
Modern SaaS applications rarely consist of a single service. Instead, requests travel across multiple microservices before returning to users.
Distributed tracing follows an individual request throughout its entire journey. Instead of reporting only the total response time, tracing identifies exactly how much time each service spends processing the request.
For example, an order submission may spend:
Without tracing, engineers know only that the request required 380 milliseconds. With tracing, they immediately identify the database and payment service as the primary contributors to latency.
This level of visibility allows optimization efforts to focus on the components responsible for delays rather than making broad infrastructure changes based on incomplete information.
Turning Metrics into Action
Collecting performance metrics alone does not improve scalability. The value lies in understanding how these measurements relate to one another.
For example, rising response times accompanied by stable CPU usage may indicate a database bottleneck rather than insufficient application servers. Increasing queue depth alongside growing API latency may suggest that background workers depend on a slow external service. Similarly, a declining cache hit ratio often explains increased database load without requiring additional database hardware.
Successful engineering teams establish performance baselines under normal operating conditions and continuously compare current metrics against those baselines. This approach makes unusual behavior easier to detect and allows performance issues to be addressed before users begin experiencing noticeable slowdowns. Similar to how an SEO team monitors the quality of each backlink to protect search visibility, engineering teams continuously monitor system metrics to identify issues before they affect users.
Once reliable metrics are available, architectural decisions become evidence-based rather than reactive. Instead of guessing which component requires optimization, engineers can identify the limiting factor, measure its impact, implement targeted improvements, and verify the results through measurable performance gains.
Horizontal vs. Vertical Scaling
Identifying a bottleneck is only the first step. Once engineers understand where the limitation exists, they must decide how to increase the application’s capacity. The two primary approaches are vertical scaling and horizontal scaling. Both improve performance, but they solve different problems and involve different trade-offs.
Vertical scaling increases the resources available to a single server. This may involve adding more CPU cores, increasing memory, upgrading storage, or moving to a more powerful cloud instance. Because the application continues running on one machine, implementation is usually straightforward and requires minimal architectural changes.
          Before

      +----------------+
      |   4 vCPU       |
      |   16 GB RAM    |
      +----------------+

              │
              ▼

          After Upgrade

      +----------------+
      |   16 vCPU      |
      |   64 GB RAM    |
      +----------------+
For smaller SaaS platforms, vertical scaling is often the quickest way to handle increasing demand. A database server experiencing moderate resource pressure may perform significantly better after receiving additional memory or faster storage. Likewise, an application server processing CPU-intensive workloads can often support more concurrent users after upgrading its processor.
Despite its simplicity, vertical scaling has practical limitations. Every server has a maximum hardware configuration, and larger instances become progressively more expensive. In addition, relying on a single machine creates a single point of failure. If that server experiences hardware problems or requires maintenance, the entire application may become unavailable.
Horizontal scaling addresses these limitations by distributing workloads across multiple servers instead of relying on one increasingly powerful machine.
                Load Balancer
                      │
      ┌───────────────┼───────────────┐
      ▼               ▼               ▼
+-------------+ +-------------+ +-------------+
| App Server 1| | App Server 2| | App Server 3|
+-------------+ +-------------+ +-------------+
Incoming requests first reach a load balancer, which distributes traffic among available servers. Because requests are shared across multiple instances, no individual server becomes responsible for handling every user. As demand increases, additional servers can be added without interrupting application availability.
Horizontal scaling also improves reliability. If one application server becomes unavailable, the load balancer automatically redirects incoming requests to healthy instances. Users may never notice that one server has failed because other servers continue processing requests.
However, horizontal scaling introduces additional architectural considerations. Application servers should remain stateless, meaning they should not store user-specific information in local memory between requests. If one request reaches Server A and the next reaches Server B, both servers must have access to the same user session.
Many SaaS platforms solve this by storing session information in shared storage systems such as Redis or distributed databases rather than on individual application servers. This allows requests to move freely between servers without affecting user experience.
File storage presents another challenge. If users upload documents or images, storing those files on local disks creates inconsistencies because other servers cannot access them. Modern applications typically use centralized object storage services so every application instance works with the same data regardless of which server processes the request.
Databases require special consideration during horizontal scaling. While application servers can usually be added easily, databases cannot always distribute workloads as efficiently. Multiple servers attempting to read and write the same data introduce synchronization challenges.
A common solution involves separating read and write operations. One primary database handles updates, while one or more read replicas process read-only queries.
              Application

                   │

         ┌─────────┴─────────┐

         ▼                   ▼

 Primary Database      Read Replica(s)

      Writes              Read Queries
This approach significantly reduces pressure on the primary database because many user requests involve retrieving information rather than modifying it.
Applications with extremely large datasets may eventually require database partitioning or sharding. Instead of storing every record in one database, data is distributed across multiple independent databases according to predefined rules. For example, customers from different geographic regions may be stored on separate database clusters. Since each server manages only a portion of the total data, workloads become more evenly distributed.
Although sharding improves scalability, it also increases operational complexity. Cross-shard queries become more difficult, data migrations require careful planning, and maintaining consistency across multiple databases demands additional engineering effort. Because of these trade-offs, organizations typically optimize indexing, query performance, and replication before introducing sharding.
Scaling decisions should always be guided by measured bottlenecks rather than assumptions. Consider an application where the database consistently reaches high utilization while application servers remain mostly idle. Adding more application servers will not improve performance because every server still depends on the same overloaded database.
Similarly, if CPU utilization remains high across all application instances while the database performs efficiently, increasing database capacity provides little benefit. In this case, additional application servers or optimized application code will produce better results.
Cloud platforms have also made automatic scaling a practical option for many SaaS businesses. Instead of manually provisioning servers during traffic spikes, autoscaling policies monitor metrics such as CPU utilization, request rate, or queue length. When predefined thresholds are exceeded, new application instances are created automatically. As demand decreases, unused instances are removed to reduce infrastructure costs.
Autoscaling improves resource efficiency, but it should not be treated as a substitute for optimization. An inefficient SQL query, excessive API calls, or a poorly designed caching strategy will continue consuming unnecessary resources regardless of how many servers are added. Scaling inefficient software simply increases operational costs while preserving the original bottleneck.
Successful SaaS architectures rarely rely on one scaling strategy alone. Many organizations begin with vertical scaling because it requires fewer architectural changes. As user traffic, data volume, and service complexity increase, they gradually adopt horizontal scaling for application services while introducing replication, distributed caching, message queues, and load balancing where appropriate. This phased approach is often recommended by an experienced SEO consulting agency when advising SaaS businesses, as maintaining a fast, reliable platform supports both user experience and long-term search performance.
Conclusion
Scaling a SaaS platform is not simply a matter of increasing server capacity. As applications evolve, requests travel through databases, APIs, caches, background workers, and external services, creating multiple points where performance can decline. A bottleneck occurs whenever one of these components cannot keep pace with the rest of the architecture, reducing the efficiency of the entire system.
The most effective way to build scalable software is to identify constraints through measurable performance data rather than assumptions. Metrics such as response latency, throughput, database query performance, queue depth, cache hit ratio, and resource utilization provide clear insight into where delays originate. Once the limiting component has been identified, engineering teams can implement targeted optimizations that improve performance without introducing unnecessary infrastructure costs.
There is no single architecture that suits every SaaS platform. Smaller applications may benefit from vertical scaling, while growing products often require load balancing, distributed caching, database replication, asynchronous processing, and horizontal scaling. The right solution depends on the workload, traffic patterns, and operational requirements of the application.